Top makes
- BMWn=119 · Established signal26.4%
- Toyotan=63 · Developing signal14.0%
- Fordn=52 · Developing signal11.5%
- Mercedes Benzn=48 · Developing signal10.6%
- Hyundain=28 · Early signal6.2%
Share of make-specific searches.
Choose the account type that applies to you. You will be taken to the correct secure login page.

Live rolling six-month SearchMyRide buyer-intent research for South Africa, covering specific makes, models, affordability, preferences, unmet demand and live vehicle supply with exact sample sizes and machine-readable data.
Five quick findings from the live six-month evidence window. Every card shows the evidence base behind it.
The strongest observed makes, models and vehicle preferences in plain language.
Share of make-specific searches.
Share of make+model-specific searches.
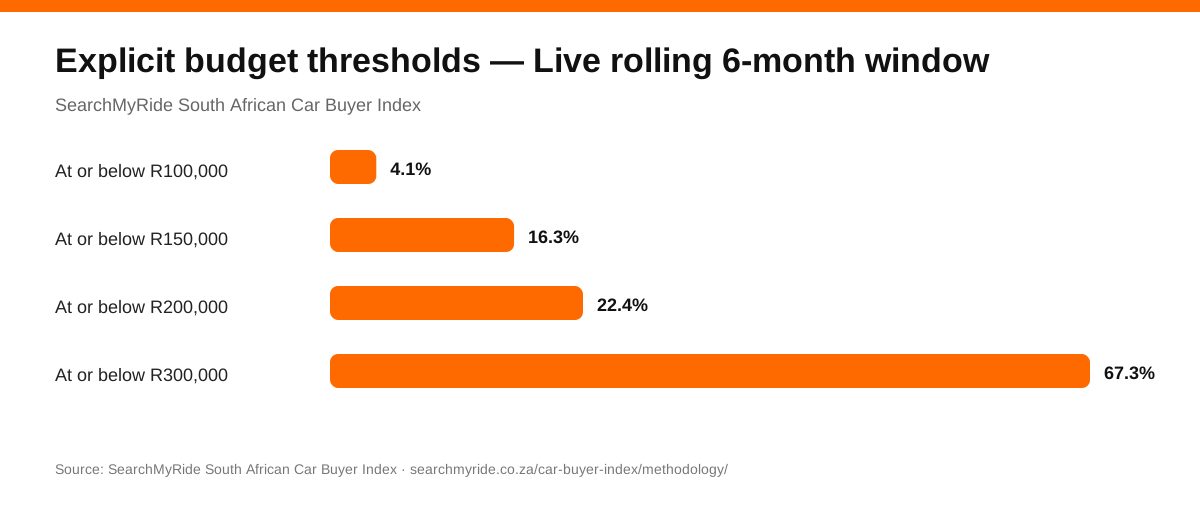
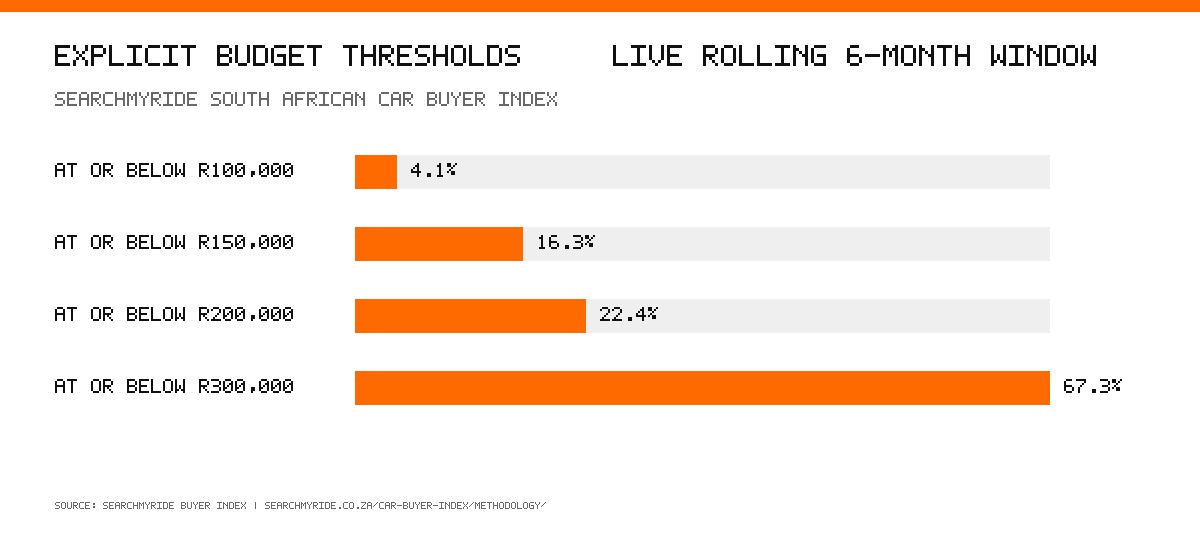
Why this matters: Stated buyer budgets describe what shoppers say they can spend; live asking prices describe current SearchMyRide supply. They are shown separately and are not lending or affordability approvals.
Latest 30 days versus the previous 30 days. Headline cards avoid presenting tiny one-observation changes as major trends.
6.2% of recent specified searches
4.3% of recent specified searches
3.8% of recent specified searches
3.8% of recent specified searches
Each pie uses a single, explicit denominator and groups the long tail into “Other” where needed so the whole circle remains statistically honest.
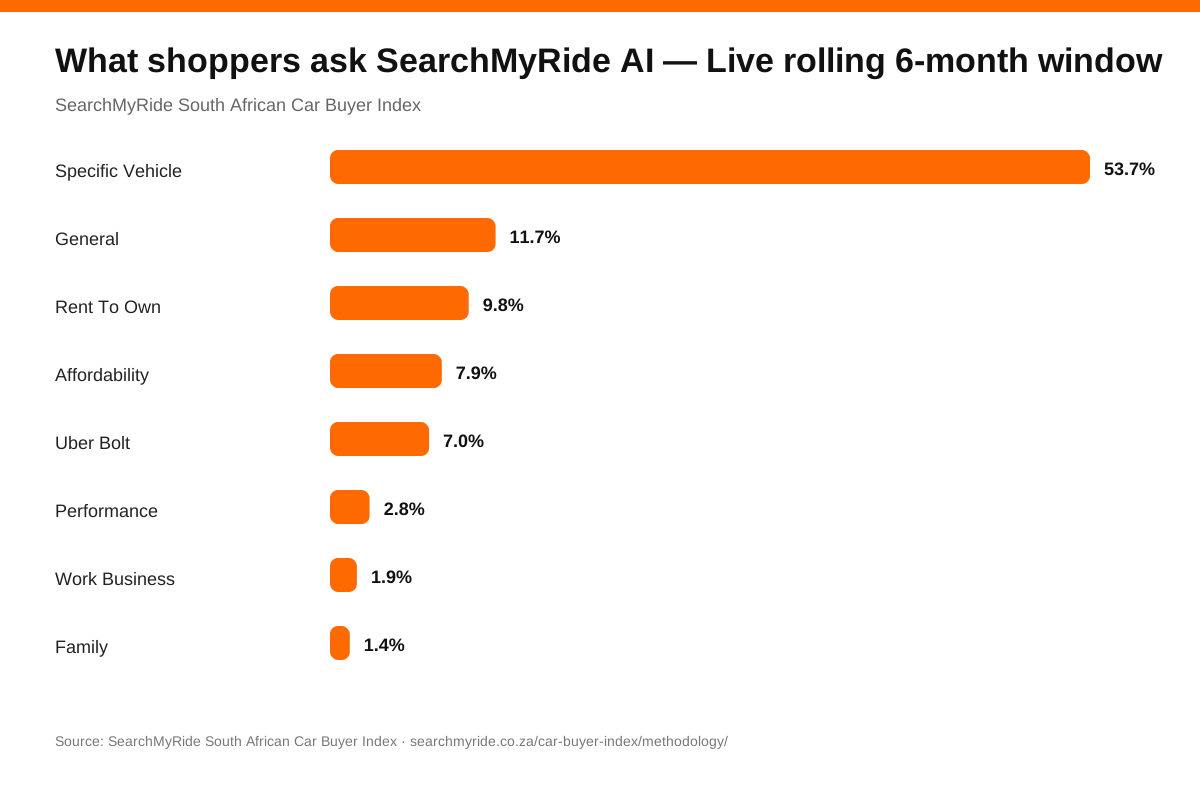
Primary intent across qualifying SearchMyRide searches. Base n=663.
Only searches that explicitly specified a body type are included. Base n=148.
This connects recommendation exposure, engagement, enquiry and downstream outcome evidence without exposing individual buyers. It measures SearchMyRide product behaviour, not national vehicle sales.
Each exposure is assigned to one strongest recorded downstream state, so the slices are mutually exclusive. Base n=26,568.
Latest recorded stage among journeys active inside the rolling reporting window. Base n=45,522.
Rates use canonical ranked vehicle exposures as the common denominator. A single exposure can appear in multiple progression stages, so these bars are intentionally not a pie chart.
Base n=26,568 canonical ranked vehicle exposures in the rolling window. Recorded purchase/lost states depend on downstream outcome capture and may lag the original recommendation.
2 quality-validated zero-result search attempts were observed across 2 unique buyer journey/day demand signals.
Likely input mistakes, parsing uncertainty, system failures and over-constrained combinations are excluded from qualified unmet demand. Raw exact-zero telemetry: 10.5% (2 of 19 searches). Exact sourcing gaps remain available in subscriber Dealer Intelligence.
The report updates continuously as new qualifying buyer searches arrive. Small samples stay visible, but every figure keeps its exact n so readers can judge how mature the evidence is.
This shows how often shoppers explicitly supplied each field. A field can be absent from a valid search.
| Specified field | Observations | Share of searches | Signal |
|---|---|---|---|
| Make specified | 451 | 68.0% | Established signal |
| Make + model specified | 249 | 37.6% | Established signal |
| Province specified | 222 | 33.5% | Established signal |
| City specified | 6 | 0.9% | Very early signal |
| Body type specified | 148 | 22.3% | Established signal |
| Transmission specified | 60 | 9.0% | Developing signal |
| Fuel type specified | 34 | 5.1% | Developing signal |
| Condition specified | 28 | 4.2% | Early signal |
| Mileage ceiling specified | 7 | 1.1% | Very early signal |
| Explicit vehicle budget | 49 | 7.4% | Developing signal |
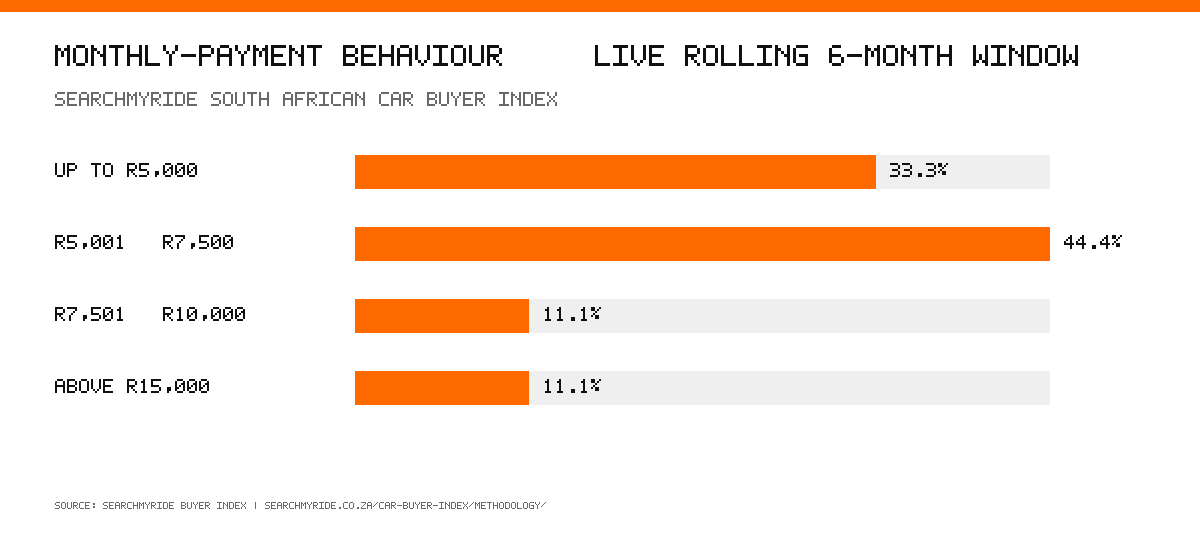
| Explicit monthly payment | 18 | 2.7% | Early signal |
| Rent-to-own intent | 21 | 3.2% | Early signal |
| E-hailing intent | 20 | 3.0% | Early signal |
| AI / natural-language / voice | 211 | 31.8% | Established signal |
| Zero-result search | 85 | 12.8% | Developing signal |
Shows how qualifying SearchMyRide Buyer Index evidence entered the dataset. Traffic acquisition and product-surface mix can influence observed demand and should be considered when interpreting the sample.
Most current live prices fall between R189,500 and R425,000. 1,120 live indexed vehicles are included in this supply reference.
A simple monthly view of how much evidence contributes to the live report.
| Month | Searches | Journeys | Make | Make + model | Budget n | Payment n | Zero-result rate |
|---|---|---|---|---|---|---|---|
| Aug 2026 | 257 | 91 | 167 | 100 | 33 | 6 | — |
| Sep 2026 | 406 | 127 | 284 | 149 | 16 | 12 | 10.5% |
Permanent daily snapshots remain the audit source for custom historical reporting.
Last 30 days compared with the previous 30 days. Read movement together with the latest sample size.
6.2% now · 0.0% before
0.0% now · 5.3% before
0.0% now · 5.3% before
0.0% now · 5.3% before
0.0% now · 5.3% before
0.9% now · 5.3% before
0.9% now · 5.3% before
4.3% now · 0.0% before
3.8% now · 0.0% before
3.8% now · 0.0% before
| Segment | Latest n | Latest share | Previous share | Change | Signal |
|---|---|---|---|---|---|
| BMW X3 | 13 | 6.2% | 0.0% | +6.2 pp | Early signal |
| Mercedes-Benz C200 | 0 | 0.0% | 5.3% | -5.3 pp | No observations yet |
| Hyundai I10 | 0 | 0.0% | 5.3% | -5.3 pp | No observations yet |
| Mercedes-Benz GLC | 0 | 0.0% | 5.3% | -5.3 pp | No observations yet |
| Volkswagen GTI | 0 | 0.0% | 5.3% | -5.3 pp | No observations yet |
| Volkswagen Tiguan | 2 | 0.9% | 5.3% | -4.4 pp | Very early signal |
| Toyota Corolla | 2 | 0.9% | 5.3% | -4.4 pp | Very early signal |
| Toyota Hilux 2.8 GD-6 Raider 4X4 A/T P/U D/C | 9 | 4.3% | 0.0% | +4.3 pp | Very early signal |
| BMW 3 Series | 8 | 3.8% | 0.0% | +3.8 pp | Very early signal |
| Toyota Hilux 2.5 Double Cab 4X4 | 8 | 3.8% | 0.0% | +3.8 pp | Very early signal |
Each statement below is generated from deterministic metrics and is scoped explicitly to SearchMyRide data.
Use the SearchMyRide scope, reporting window and sample size when quoting a finding.
Download report data (CSV) · Machine-readable claims · Methodology
| Date | Qualifying searches |
|---|---|
| 2026-08-16 | 2 |
| 2026-08-17 | 30 |
| 2026-08-18 | 30 |
| 2026-08-19 | 17 |
| 2026-08-20 | 3 |
| 2026-08-21 | 5 |
| 2026-08-22 | 45 |
| 2026-08-23 | 24 |
| 2026-08-24 | 1 |
| 2026-08-25 | 20 |
| 2026-08-26 | 41 |
| 2026-08-27 | 16 |
| 2026-08-28 | 10 |
| 2026-08-29 | 11 |
| 2026-08-30 | 1 |
| 2026-08-31 | 1 |
| 2026-09-01 | 11 |
| 2026-09-02 | 20 |
| 2026-09-03 | 22 |
| 2026-09-04 | 14 |
| 2026-09-05 | 17 |
| 2026-09-06 | 11 |
| 2026-09-07 | 4 |
| 2026-09-09 | 2 |
| 2026-09-10 | 60 |
| 2026-09-11 | 22 |
| 2026-09-12 | 79 |
| 2026-09-13 | 5 |
| 2026-09-14 | 55 |
| 2026-09-15 | 8 |
| 2026-09-16 | 32 |
| 2026-09-17 | 27 |
| 2026-09-18 | 5 |
| 2026-09-19 | 5 |
| 2026-09-20 | 1 |
| 2026-09-21 | 4 |
| 2026-09-22 | 2 |
Only explicitly stated maximum vehicle prices are included.
Share of qualifying searches that explicitly specified both make and model. Base n=249.
Search share uses qualifying searches that explicitly named both make and model. Live-stock share uses all current indexed SearchMyRide vehicles. The percentage-point gap is directional marketplace context, not national market share.
| Vehicle | Search share | Live-stock share | Share gap | Searches | Live stock | Searches/listing |
|---|---|---|---|---|---|---|
| Ford Ranger | 10.8% | 0.0% | +10.8 pp | 27 | — | — |
| Toyota Hilux | 6.4% | 0.0% | +6.4 pp | 16 | — | — |
| BMW X3 | 5.2% | 0.7% | +4.5 pp | 13 | 8 | 1.63 |
| Mercedes-Benz C-Class | 4.4% | 0.0% | +4.4 pp | 11 | — | — |
| BMW X5 | 4.0% | 0.9% | +3.1 pp | 10 | 10 | 1.00 |
| Toyota Hilux 2.8 GD-6 Raider 4X4 A/T P/U D/C | 3.6% | 0.1% | +3.5 pp | 9 | 1 | 9.00 |
| Toyota Hilux 2.5 Double Cab 4X4 | 3.2% | 0.1% | +3.1 pp | 8 | 1 | 8.00 |
| BMW 3 Series | 3.2% | 0.0% | +3.2 pp | 8 | — | — |
Ford Ranger leads Toyota Hilux by 4.4 percentage points of make+model-specific search share. Exact make/model buyer-budget gaps are reserved for active dealership subscribers in Dealer Intelligence.
A separate 183-day lead-attribution cohort connects enquiry outcomes with buyer, dealer and inventory evidence. It does not change or inflate Buyer Index search-demand counts.
Evidence rule: Only dealer/buyer confirmations or confidence-threshold evidence are labelled as sales. Inventory withdrawal alone is never reported as a verified transaction. When one vehicle has several recent leads, the stock event remains vehicle-level and unresolved until the correct enquiry is identified.
Intent categories generated by SearchMyRide search classification. Base n=663.
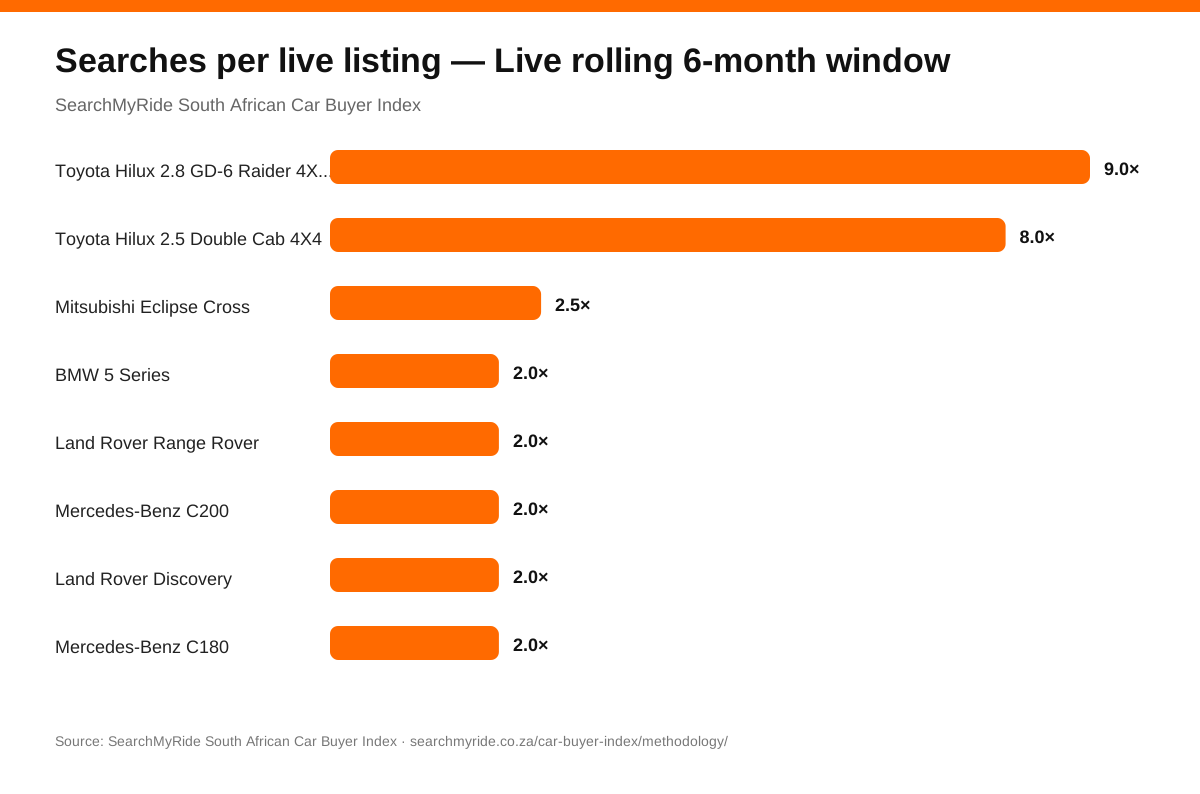
| Vehicle | Qualifying searches | Live stock | Searches / listing |
|---|---|---|---|
| Toyota Hilux 2.8 GD-6 Raider 4X4 A/T P/U D/C | 9 | 1 | 9.00 |
| Toyota Hilux 2.5 Double Cab 4X4 | 8 | 1 | 8.00 |
| Mitsubishi Eclipse Cross | 5 | 2 | 2.50 |
| BMW 5 Series | 6 | 3 | 2.00 |
| BMW 320D | 2 | 1 | 2.00 |
| Audi A5 | 2 | 1 | 2.00 |
| Mercedes-Benz Vito | 2 | 1 | 2.00 |
| Land Rover Range Rover | 2 | 1 | 2.00 |
Directional SearchMyRide marketplace ratio. It does not measure national registrations or total market demand.
Latest 30 days compared with the preceding 30 days inside the rolling six-month evidence window. Every observed make may appear; n and signal strength show how mature each movement is.
| Make | Previous 30d | Latest 30d | Change | Evidence |
|---|---|---|---|---|
| BMW | 10.1% (n=8) | 29.8% (n=111) | +19.7 pp | Established signal |
| Kia | 10.1% (n=8) | 0.0% (n=0) | -10.1 pp | No observations yet |
| Hyundai | 12.7% (n=10) | 4.8% (n=18) | -7.9 pp | Early signal |
| Mercedes Benz | 15.2% (n=12) | 9.7% (n=36) | -5.5 pp | Developing signal |
| Volkswagen | 8.9% (n=7) | 3.8% (n=14) | -5.1 pp | Early signal |
| Mazda | 3.8% (n=3) | 0.5% (n=2) | -3.3 pp | Very early signal |
| Land Rover | 0.0% (n=0) | 3.2% (n=12) | +3.2 pp | Early signal |
| Toyota | 11.4% (n=9) | 14.5% (n=54) | +3.1 pp | Developing signal |
| Mitsubishi | 1.3% (n=1) | 3.8% (n=14) | +2.5 pp | Early signal |
| Renault | 1.3% (n=1) | 3.0% (n=11) | +1.7 pp | Early signal |
| Jeep | 0.0% (n=0) | 1.6% (n=6) | +1.6 pp | Very early signal |
| Baic | 1.3% (n=1) | 0.0% (n=0) | -1.3 pp | No observations yet |
This measures SearchMyRide consideration share, not vehicle registrations or national sales. Percentage-point movement should be read together with the exact counts.
Regional and conversational-intent views use the same live rolling six-month evidence base and publish exact denominators.
Use the underlying published data and methodology when quoting SearchMyRide. Downloads contain only aggregate-safe report data.
SMR-CBI-ROLLING-6M · Dataset v2.0 · n=663 · data through 22 Sep 2026
This report separates observed SearchMyRide buyer intent from live marketplace supply and publishes only segments that meet stated evidence thresholds.
Watch: Watch for sustained changes across multiple reporting periods rather than treating one short-term movement as a market-wide conclusion.
All numerical claims on this page come from deterministic calculations over the Buyer Index evidence table and the live inventory index.
Current SearchMyRide stock provides supply context; these listings are not used to manufacture buyer-demand observations.

Randburg, Gauteng
View car →
Randburg, Gauteng
View car →
Randburg, Gauteng
View car →
Randburg, Gauteng
View car →
Randburg, Gauteng
View car →
Randburg, Gauteng
View car →No. It describes qualifying SearchMyRide search activity during the stated period. SearchMyRide publishes the sample size and methodology so the scope is explicit.
No. Statistics are calculated deterministically from stored evidence. The optional AI layer is restricted to non-numeric interpretation and is rejected if it introduces numbers or currency values.
The primary report is a live rolling 183-day analysis that refreshes as new qualifying evidence arrives. Aggregate daily snapshots are retained for historical reporting, and fixed month boundaries remain available internally for audit and archive reconstruction.